For Daily Job Alert For Daily Job Alert |
Join Our Whats App Channel |
| For Free Study Material |
Join Our Telegram Channel |
Quant Quiz On Radar DI Day 9 Bag
Buy Quant & Reasoning Tricks Book – Buy Now
I. Study the following Radar Graph and answer the given questions
Number of new countries registered (in thousand) in four countries in various years.
- In which year is the average of the number of companies registered the maximum?
A. 2008
B. 2010
C. 2009
D. 2011 - The number of companies registered in 2015 is what percentage more or less than the number of companies registered in the year 2008?
A. 44.44%
B. 43.75%
C. 22.22%
D. 11.11% - What is the ratio of the number of companies registered in Japan to that in China during 2008 to 2015?
A. 39:40
B. 23:24
C. 40:41
D. 24:23 - The total number of companies registered in France is how much more or less than the total number of companies registered in China?
A. 34.14%
B. 33.13%
C. 29.16%
D. 11.11% - In which country is the average number of companies registered the maximum?
A. Germany
B. Japan
C. China
D. France
II. Study the Radar Graph carefully and answer the questions given below.
The graph shows annual income (in Crore) of eight companies (CTS, TCS, Wipro, Infosys, HCL, Tech Mahindra, IBM, L&T) in three years 2013, 2014, 2015.
- Which of the following company earns the maximum income during three years?
A. TCS
B. Infosys
C. HCL
D. Tech Mahindra - Income of CTS in 2014 is what percentage less than the income of Infosys in 2015?
A. 50/3%
B. 55/3%
C. 59/3%
D. 61/3% - If the profit of IBM is 12% of its annual income in 2013 and the profit of Wipro is 14% of its annual income in 2015, then what is the difference between the expenditure of Wipro in 2015 and that of IBM in 2013?
A. 16.2 crore
B. 17.2 crore
C. 18.2 crore
D. 19.2 crore - If the expenditure of Tech Mahindra is 82% of its income in 2014 and that of Wipro is 84% of its income in 2015. What is the ratio of their profits in 2014 to that in 2015.
A. 27:56
B. 33:57
C. 25:56
D. 25:57 - What is the ratio of the total income of HCL and Tech Mahindra over the given period?
A. 7:5
B. 3:5
C. 2:5
D. 2:7
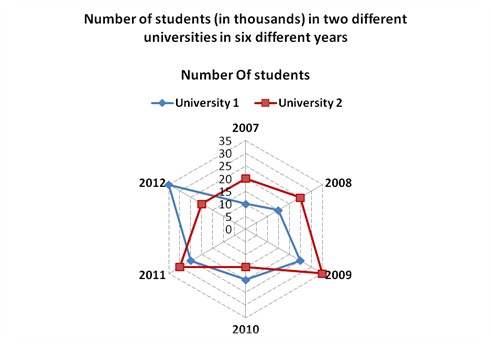
Directions: Study the radar graph carefully and answer the questions that follow:
Number of students (in thousands) in two different universities in six different years
Number of Students

6. What was the difference between the number of students in university-1 in the year 2010 and the number of students in university-2 in the year 2012?
(1) Zero (2) 5,000
(3) 15,000 (4) 1,0000
(5) 1,000
7. What is the sum of number of students in university-1 in the year 2007 and the number of students in university-2 in the year 2011 together?
(1) 50,000 (2) 55000
(3) 45000 (4) 57000
(5) 40000
8. If 25% of the students in university-2 in the year 2010 were females, what was the number of male students in the university-2 in the same year?
(1) 11250 (2) 12350
(3) 12500 (4) 11500
(5) 11750
9. What was the percent increase in the number of students in University-1 in the year 2011 as compared to the previous year?
(1) 135 (2) 15
(3) 115 (4) 25
(5) 35
10. In which year was the difference between the number of students in university-1 and the number of students in univeisity-2 highest?
(1) 2008 (2) 2009
(3) 2010 (4) 2011
(5) 2012
Answers of Above Questions
6. (1) 7. (5) 8. (1) 9. (4) 10. (5)
Directions (Q. 1-5): Study the following radar graph carfully to answer the questions that follow: Number of seats won by various political parties in the legistative assemblies of different states
- The total number of seats won by the BSP is what per cent more or less than that by the Left parties in all states together?
1) 8.21% more
2) 7.69% less
3) 6.56% more
4) 9.71% less
5) 10% less
- What is the ratio of the total number of seats won by the BJP to the total number of seats won by the Congress in all states together?
1) 3 : 2
2) 4 : 5
3) 5 : 6
4) 6 : 7
5) 8 : 7
- If 30% seats of the Maharashtra legislative assembly are won by the females and 40% seats of the Gujarat legislative assembly are won by the females, then the male members of the Maharashtra legislative assembly are what per cent more or less than the male members of the Gujarat legislative assembly?
1) 2.08% more
2) 3.18% less
3) 4.28% more
4) 5.38% more
5) 6.48% less
- 40% members of the Haryana legislative assembly and 50% members of the UP legislative assembly are chargesheeted for involvement in crimes. Among these, 50% and 20% are females in the Haryana and UP legislative assembly respectively. Then the number of male members of the Haryana legislative assembly who are chargesheeted is what percentage more or less than the number of female members of the UP legislative assembly who are chargesheeted?
1) 250% more
2) 300% more
3) 142.85% more
4) 230% less
5) 220.45% less
- Which political party won the highest number of seats in the given eight states?
1) BSP
2) Left parties
3) Congress
4) BJP
5) Either BJP or BSP
Answers:
- 2
- 5
- 1
- 3
- 4
Directions (Q. nos. 1 to 5): Study the following radar graph carefully and answer the questions that follow.
1. What was the difference between the number of students in university 1 in the year 2010 and the number of students in university 2 in the year 2012?
(1) 0 (2) 5000 (3) 15000 (4) 10000 (5) 1000
2. What is the sum of the number of students in university 1 in the year 2007 and the number of students in university 2 in the year 2011 together?
(1) 50000 (2) 55000 (3) 45000 (4) 57000 (5) 40000
3. If 25% of the students in university 2 in the year 2010 were females, what was the number of male students in the university 2 in the same year?
(1) 11250 (2) 12350 (3) 12500 (4) 11500 (5) 11750
4. What was the per cent increase in the number of students in university 1 in the year 2011 as compared to the previous year?
(1) 135 (2) 15 (3) 115 (4) 25 (5) 35
5. In which year the difference between the number of students in university 1 and the number of students in university 2 highest?
(1) 2008 (2) 2009 (3) 2010 (4) 2011 (5) 2012
Correct answers are
1 (1) 2(5) 3(1) 4(4) 5(5)