
Direction (1-5): Study the given graphs to answer the questions.
Production of wheat in different countries

Total Production=50 lakh Tonnes
Production: Scientific Vs Conventional Methods in Percentage

1. What is the difference between the production by scientific method and conventional method in Indonesia?
- (1) 2.3 lakh tonnes
- (2) 2.8 lakh tones
- (3) 2.5 lakh tonnes
- (4) 3 lakh tones
- (5) None of these
2. What is the average production of wheat by scientific method for all the countries?
- (1) 3.1 lakh tonnes
- (2) 4.24 lakh tones
- (3) 2.6 lakh tonnes
- (4) 3.07 lakh tones
- (5) None of these
3. What is the ratio of production by conventional method in Pakistan to that by scientific method in Japan?
- (1) 9/40
- (2) 99/260
- (3) 51/260
- (4) 48/77
- (5) None of these
4. The production of wheat in Sri Lanka by Conventional method is approximately how many times the production in India by scientific method?
- (1) 1.2
- (2) 1.5
- (3) 0.9
- (4) 2.1
- (5) None of these
5.The production of wheat in India by Scientific method is approximately how many times the production in Pakistan by Conventional method?
- (1) 2.88
- (2) 2.07
- (3) 2.61
- (4) 0.81
- (5) None of these
Direction (6-10): Study the given graphs to answer the questions.
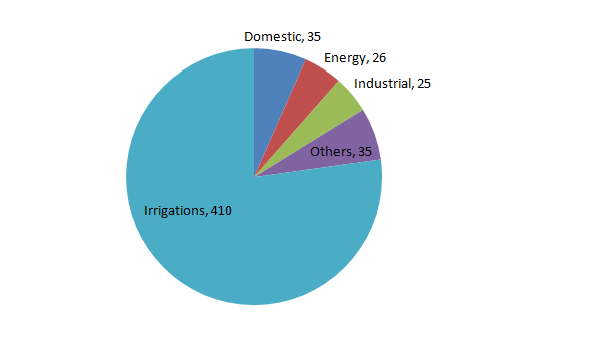
Water Usage in 2006 (In Trillion Litres)
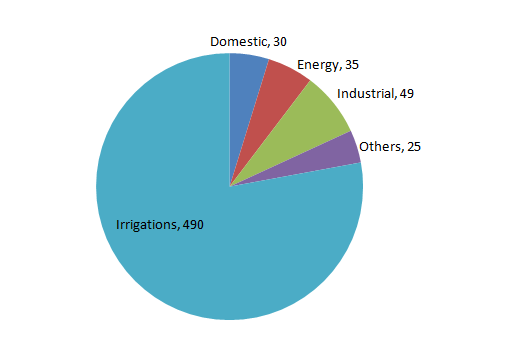
Water Usage in 2009 (In Trillion Litres)
6: If the ratio of processing cost for water for industrial, energy and domestic usage is 3 : 5 : 2, what is the ratio of processing cost for above mentioned usage in 2006 to that in 2009?
(a) 0.68
(b) 0.72
(c) 0.60
(d) 0.77
(e) 0.73
7: What is the percentage increase in usage in energy related sector from 2006 to 2009?
(a) 34.6%
(b) 23.3%
(c) 15.4%
(d) 17%
(e) 33%
8: What is the irrigation usage as percentage of total usage in 2009?
(a) 65.18%
(b) 83.45%
(c) 77.9%
(d) 69.6%
(e) 77%
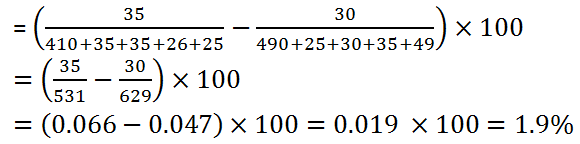
9: What is the difference in domestic usage as percentage of total usage between 2006 and 2009?
(a) 3.16
(b) 2.08
(c) 2.26
(d) 1.91
(e) 2%
10: Which one out of the four shows the highest percentage increase in usage from 2006 to 2009?
(a) Domestic
(b) Industrial
(c) Others
(d) Energy
(e) Irrigations
SOLUTIONS

- (1) Production In Indonesia = 50 * 10/100 = 5 lakh tones
Difference= 5 * (73 – 27) /100 = 2.3 lakh tones
- (2) Production of wheat by scientific method in
India= 50 * (18/100) * (32/100) = 2.88 lakh tones
Japan = 50 * (20/100) * (78/100) = 7.8 lakh tones
China= 50 * (22/100) * (70/100) = 7.7 lakh tones
Bangladesh= 50 * (8/100) * (20/100) = 0.8 lakh tones
Pakistan= 50 * (9/100) * (66/100) = 2.97 lakh tones
Indonesia= 50 * (10/100) * (73/100) = 3,65 lakh tones
Sri Lanka= 50 * (13/100) * (60/100) = 3.9 lakh tones
So Avrg = (2.88 + 7.8 + 7.7 + 0.8 + 2.97 + 3.65 + 3.9)/7 = 4.24 lakh tones
- (3) Production by conventional method in Pakistan = 50 * (9/100) * (34/100) = 1.53 lakh tones
Production by scientific method in Japan= 7.8 lakh tones
Required ratio= 1.53 : 7.8 = 51 : 260
- (3) Production of wheat in Sri Lanka by Conventional method= 50 * (13/100) * (40/100) = 2.6 lakh tones
Production in India by scientific method= 50 * (18/100) * (32/100) = 2.88 lakh tones
According to question, 2.88 * x = 2.6
x = 2.6/2.88 = 0.9 times
- (5) Production of wheat in India by Scientific method= 50 * (18/100) * (32/100) = 2.88 lakh tones
Production in Pakistan by Conventional method=50 * (9/100) * (34/100) = 1.53 lakh tones
According to question = 2.88/1.53 = 1.88 times
6. (b) Ratio of cost
![]()
7. (a) Required percentage
![]()
8. (c) Required percentage
![]()
9. (d) Required Difference
10. (b) We can see from the graph that for industrial sector, the usage is increased from 25 to 49 which is 96%. Hence, this is the maximum increase. For no other sector the usage became almost double.


 for All Posts 2025 – Check Now")

 – Railway NTPC Cutoff Marks")


